
 Denver Public Schools has released their 2013 School Performance Framework (SPF). The summary is mixed — the distribution of performance has stretched, so there are more kids in both the highest-quality and the lowest-quality schools. When aggregated, the gains are positive: more kids are in quality schools in Denver than at any point in the past five years.
However beyond the initial rays of light are two deeply troubling trends. First, the performance of the best district-operated schools continues to depend predominantly on the demographics of the kids they serve. Second, there appears to be no connection – particularly in the secondary grades — between the district’s efforts to improve its traditional schools and their subsequent performance.
The Sun and the Shadows
The big picture shows an undeniable increase in average quality across the city. The SPF has oddly irregular breakpoints: the district divides performance into bands which vary from a range of 33 percentage points to just 5 percentage points. That’s never made much sense to me, and for this analysis I am looking at the number of students in schools at each evenly distributed quintile of performance.
 The percentage of students in schools in the top quintile has increased from 5.1% in 2009 to 11.7% in 2013. That’s a rising sun, however it casts shadows: the number of kids in the bottom quintile has also grown — from 0.3% to 2.3% of students. There were so few of these students in 2009, they are invisible on the chart, in the past two years they have quietly risen.
Indeed, while Denver has seen an increase at the top levels of performance, the bottom two quintiles still have the same percentage of kids (about 20%) that they did five years ago. Yet DPS has closed outright 10 of the schools that were in this group in 2009, which means that although the percentage of students has stayed the same, many of the schools are different. Fully 13 schools who were at an SPF level of 40% or better five years ago have since declined into these bottom two quintiles. A lot more schools are falling down the performance ladder than climbing up it.
So, after the shine of first light, far more interesting are two questions. First, what are the characteristics of Denver’s highest-performing public schools? And second, how effective is DPS – particularly where the need is most acute – at improving school performance?
Top Quintile Schools
To look at schools with high performance, we’ll focus on the 20 schools in the top quintile on the 2013 SPF, each of whom received between 80% and 100% of possible points (which matches DPS’s “distinguished” category).
The first characteristic is simple: certain charter schools dominate this list. Three top charter networks (DSST, STRIVE Prep, and KIPP) now account for nine of the highest-ranked 20 schools in the city. Their growth makes a difference: in 2009 there were two top-quintile charter schools serving 883 kids; in 2013 there are nine serving 2,622 kids. This performance is not an outlier – it continues previous trends. In addition to these nine charters, there are 11 DPS-operated schools. These two groups of top-quintile school serve very different students.
Poverty and Performance
The correlation between poverty and performance has characterized urban public schools for decades, however the difference between the best schools run by DPS compared to the best schools governed under a charter is extraordinary. All nine top-quintile charter schools have more than 40% low-income kids, and three of them have low-income populations in excess of 90%. In contrast, the 11 distinguished schools that DPS operates predominantly serve students at the other end of the economic spectrum. Eight house 36% or less low-income kids (half the DPS average), and of these four school have 10% or less.
Here are all 20 top-quintile schools graphed by both SPF performance and the percentage of low-income students they serve (click on the graph for additional detail):
 For district-operated schools, higher income equates to higher achievement – this is a truism of public education which has persisted across generations. In the very best DPS-operated schools, demography is still likely to be the primary driver of academic destiny.
But the top-quintile charter schools invert this relationship: performance is not a function of income. The regression lines slope in different directions. This is a remarkable difference.
Top-quintile schools run by DPS or under a charter agreement have similar levels of SPF achievement, but they serve vastly different populations. The charter schools need to sustain this performance over time, and the different relationship between poverty and performance is less stark across all schools than it is in the top-quintile. But it persists.
Grade Level and Performance
Another unfortunate truism about public education is the decline in proficiency as students advance grade levels. In 2013 in Denver, average third grade proficiency was 53%, while in tenth grade it was 39%. The decline is similar (albeit from higher levels) across Colorado: more students fall behind grade level the older they get. To reverse this trend, Denver desperately needs strong secondary schools (grades 6-12).
Consider this: every single top-quintile charter is a secondary school (seven middle and two high schools). In contrast, the best DPS-operated schools overwhelmingly serve elementary school grades. Of the 11 top-quintile schools run by DPS, eight are exclusively elementary schools, and one more is a K-8. That leaves just two top-quintile secondary schools: McAuliffe (in their inaugural year with 22% low-income students) and East High (36% low-income). Overall, Denver averages 74% low-income students in middle school and 69% in high school; these two may be very good schools, but they do not look much like the rest of the district. Indeed, if one eliminates schools serving elementary grades, the overall performance of district-run schools plummets: just five schools (out of 35 total) are in the top two quintiles. And two of these are magnet schools who select their students based on academic proficiency or promise.
In fact, what filters through the initial sunlight of improved performance is a searing deficiency: in a district with 72% low-income students, there is not a single top-quintile secondary school operated by DPS that serves 40% or more low-income kids. Not one. Nor is this an aberration: over the past five years, there has been one DPS-run school, in one year, that met this standard. It was a new school, in their first year, serving just one grade. In their second year they fell to the third quintile.
Are Traditional DPS Schools Getting Better?
This deficiency begs an important question: are traditional DPS schools improving? Let’s look at the SPF rankings, over time, of the 21 district-run secondary schools that have at least 40% low-income students (excluding magnets and limited to schools for which there are 5 years of data):
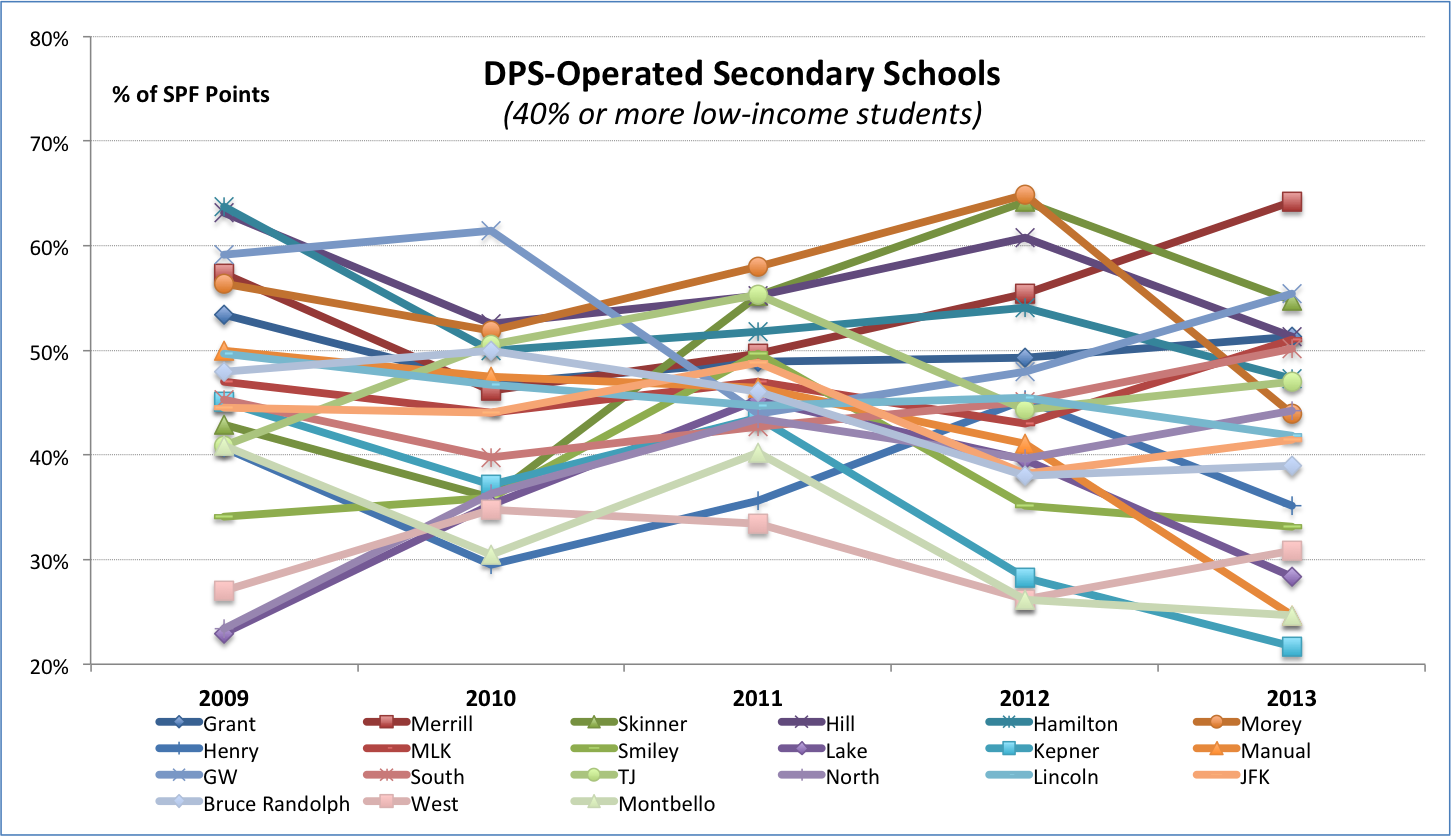
This is the area in which it is critical for Denver to make progress. Are they? Not to my eye, for there is simply no pattern here at all. The median SPF score for this cohort in 2009 was 46%; in 2013 it was 44%. Almost all of these schools were languishing in the 30% – 60% range five years ago, and almost all of them remain there today, even if their order has shuffled. And, also critically, there are no instances in the past five years where DPS has been able to transform a secondary school serving low-income kids from any of the lowest three quintiles into either of the highest two quintiles. Not one.
Particularly depressing are the schools that have undergone significant transformations, often at great expense and with considerable turmoil. Anyone who follows the news will know the names: Manual High School, profiled in the New Yorker (50% of SPF points in 2009, 25% in 2013), Bruce Randolph, mentioned by President Obama in a State of the Union address (48%, 39%), Lake (23%, 28%), Lincoln (50%, 42%) and more. It is a big enough sample where there are bound to be individual schools with praiseworthy improvements — such as North High, which has moved from an SPF score of 23% to 44% — but these are balanced by other declines, and there is a hard and low ceiling of overall achievement. In a large district, DPS can always point to anecdote, but the aggregate numbers tell a story of traditional secondary schools completely immune to the district’s medicine. Indeed, there is no historical basis to believe that DPS can operate high-quality secondary schools that serve a significant proportion of low-income students.
So what do we learn from Denver’s 2013 School Performance Framework? There are indeed more kids getting a high-quality education, and it is perhaps a natural error for many people to want these gains to be the direct result of DPS’s attentions. The district has been both loud and forceful about its efforts, and no one prefers to be a witness to success if one can claim paternity.
But the data does not agree. More kids are getting a better education, but the schools closing the achievement gap are the ones where DPS has the least influence, and the traditional schools on whom DPS has spent the most time and attention in aggregate have not improved. The most effective strategy the district has pursued and where they should receive due credit — supporting the replication of top-quintile charter schools — is one of restraint, not action.
The hard truth in this dawn of school performance is that the gains that exist are largely indifferent to the district’s efforts, and distinctly not their result. There is daylight, but the source is not what it first appears, and dawn is a long way off.

What I feel is missing here and has been missing for a long time in the DPS educational blogosphere is an analysis of the data related to the performance of middle schools housed in ECE/K-8 schools compared to all the middle schools cited above. I’ve spent hours in the data and I know there are some middle school gems, charter AND district-run, hidden within these often overlooked ECE/K-8 schools.
I see your point. I work at an Elementary school in SW Denver and always recommend to parents that they pick one of the charters instead of Kepner Middle School.
My question to you, as a former board member of STRIVE, is how can STRIVE help public schools replicate the success they are experiencing? Since I don’t work at the district level I am unaware of any sort of coordination that may exist. The ultimate goal of charters is to create this variation that helps break some of the systemic trends district wide and not with the limited populations that charters can actually reach. As an example, how can STRIVE Lake collaborate with Lake International to make both schools successful? Our ultimate goal is to push the district forward and not just select campuses.
It seems like you’re quite satisfied with the results of Charter schools and willing to attribute their success to their ability or operate separately from the district. I in no way disagree that the results of the STRIVE and DSST schools are incredible.
However, I feel that the conclusions you’ve drawn cater to your view that the answer lies within charters. Let’s look at these charters you are touting. Not one of the charter’s in the “blue” category of the SPF has an enrollment greater than 400 students. Now of course there are plenty of public schools with similar enrollment that do worse, but I would like to point out that as enrollment increases for these schools often their performance decreases. Look at STRIVE Westwood, as they continue to grow in population they perform very well but their SPF and their overall score have decreased continually since 2011.
I also wonder why you chose to not include Charters in the bottom 10 percentile in your assessment of charter success, Why not discuss the shortcomings of Northeast Academy, Wyatt, Escuela Tlatelolco, SOAR at Oaklanda, SOAR at Green Valley Ranch or Venture Prep MS? Why did these schools not enter into your correlation of charter and SPF success?
I fully believe in the success of schools like STRIVE and DSST, however, I always ask myself why more is not done to replicate the success of those schools across the city (aside from simply opening more STRIVES and DSST campuses). This is a complicated question to answer. I would just like more productive discourse from your blog and I find some of your conclusions to conveniently ignore some of Denver’s worst schools, that also happen to operate as charters, while simultaneously deriding Denver’s public schools.
Some interesting points. Thoughts:
1. The small enrollment of many top-quintile schools is partly because there seems to be a bias in the SPF to schools (both charter and DPS-run) in their first year of operation. Schools frequently score very well in the first year and then slip – some of this is simple regression to the mean, some is the scoring mechanism of the SPF itself. I personally would prefer to segregate new schools into a difference performance class (which is partly why I believe in exit-level proficiency adjusted for demographics as a better standard for performance than than the SPF).
Many top-quintile charters are new enough where they do not have a history of performance at full-enrollment, and still need to prove themselves over time. But it is worth pointing out that the longest-serving charters from each CMO (DSST: Stapleton HS, STRIVE: Federal and KIPP: Sunshine Peak) all are still top-quintile.
2. A bigger an impact on enrollment is the number of grades served. Elementary schools serving 6 grades will have more enrollment than middle schools serving 3 grades. It is just that the DPS-operated schools are heavily weighted to K-5 and K-8 schools. Slavens has 539 kids in 9 grades (ave 59), Polaris 334 (ave is 56), McMeen 595 (ave is 99). Virtually all of the charters are 100 kids or more per grade. They are “smaller” only because they serve fewer grades.
3. I don’t include a discussion of any bottom-quintile schools (aside from the percentage of kids who attend them, which has grown) because they are the rule, not the exception. Look at the link on “less stark across all schools” (which correlates all schools, including the low-perofmring charters you list). Every single school in the lowest 2 quintiles has FRL of 70% or more; the bottom quintile is 89% or more. BOth charters and DPS-run schools are subject to the gravitational pull of poverty, which has dominated public K-12 education for generations. That’s the rule. I’m interested in the instances that are the exceptions, which is the top-quintile schools with significant low-income populations.
4. My main point in the post is less about the governance structure and more about the ability to replicate. A charter is no guarantee of success, and they occupy both the top and bottom of performance in DPS. The main benefit of charters is: 1) you get more variation of models; and 2) the ability to replicate if successful, and accountability to be closed if not.
It’s not that charters in Denver are automatically more successful, it is that when they are successful one can make more of them. That is what has worked.